Hierarchical information is everywhere: Family trees, organizational charts, taxonomies or product breakdown structures. A good graphical representation can convey a lot of information very quickly. However, creating such a drawing manually is cumbersome. This article will show how such a task can be performed automatically.
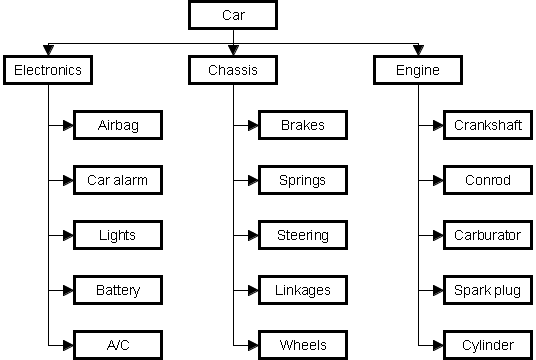
A very rough hierarchical overview (or “product breakdown structure”) of a car could look somewhat like this:

Fig. 1: A very rough hierarchical overview (or “product breakdown structure”) of a car.
The drawing in Figure 1 has several very desirable properties:
- One can grasp at a glance the hierarchical structure (father-child relationships) of the data.
- The individual subtrees (e.g. chassis and engine) are clearly separated from each other (subtree separation).
- The drawing is space saving and has been laid out in such a way that it can be printed on paper (using landscape format) quite nicely.
Classical Tree Drawing Convention vs. Tip-over Layouts
The classical tree drawing convention is aimed less at compactness (see Fig. 2). The good thing about it is that the father-child relationships are even more easily recognizable than in Figure 1. On the other hand you get an aspect ratio that is far less suitable for printing it on a sheet of paper or displaying it on a monitor.
The reason for this is that the child nodes of a father node always have to be arranged horizontally. When using tip-over layouts the children can be laid out either horizontally or vertically (see Fig. 1). Because of the ability to make this choice, we get a certain variability that makes it possible to optimize the drawing with respect to various kinds of space restrictions.
Cost Functions
The space requirements of a tip-over layout can be optimized with respect to a given cost function with variables for breadth b and height h (see [1]). A few examples:
- Area: b · h
- Circumference: 2 · (b + h)
- Minimum enclosing square: max (b, h)
- Minimum enclosing rectangle where the ratio r = b / h is given: max (b, h · r)
If you want to optimize a drawing to print well on a sheet of paper with DIN A4 landscape format you can use the latter cost function with r = 29,7 cm / 21 cm ≈ 1.414. The same aspect ratio can also be used for any other DIN A landscape format (A0, A1, A2, A3, etc.).
Meanwhile in Reality
Real world applications are obviously way more complex than the example depicted in Figure 1. Hundreds or even thousands of nodes are not uncommon and a single node might have a very large number of children, which leads to drawings with a lot of unused space. This again results in drawings which are not only difficult to display on a computer screen, but especially bad for a print-out on paper. In Figure 3 we have a drawing which is optimized for DIN A landscape format, but the variability provided by the tip-over layout algorithm is just not high enough, because all child nodes of a father node have to always be put next to each other (horizontally or vertically). This can be very disadvantageous when there are a great number of child nodes.
Therefore, in large drawings, you fairly quickly arrive at results, where you can no longer read the labels of the nodes, even if very large formats, like DIN A0, are used.
Divide and Juggle Trees
One can create space-saving drawings manually. In cases like the one in Figure 4, the creator will often use the following trick to save space: If the number of child nodes is very high, divide the child nodes into several groups (see Fig. 5). Within these groups all child nodes are laid out horizontally, the groups themselves are laid out vertically (see Fig. 6).

Fig. 6: Compact drawing of the 32 child nodes using 4 groups one below the other
In large drawings a manual layout can be very cumbersome and time consuming. Small mistakes and irregularities can easily happen, which diminish the quality of the result. Moreover, everytime a node is removed or added manual work becomes necessary again.
Loosen Up With TreeJuggler
The software TreeJuggler is able to create compact drawings automatically. It was implemented as part of the open source project Gravisto (see also [2]) in the course of my master thesis. It uses a technique that automatically loosens up the structure of a tree to make it possible to generate a space-saving tip-over layout. The following algorithm is used by the TreeJuggler Command Line Interface (TreeJugglerCLI):
- At first the tree is transformed from a tree with very high degree (many child nodes per father node) to a tree with only two child nodes per father node. This transformation is done – analogous to Fig. 5 – by inserting auxiliary nodes (see Fig. 7).

Fig. 7: Loosening a tree by reducing the number of child nodes per father node to two.
- A tip-over layout of the tree, optimized according to the chosen cost function, is generated.
- All unnecessary auxiliary nodes (the ones in which the layout direction does not change from horizontal to vertical or vice versa) are removed.
- If the value of the cost function has further decreased, then go to step 2, otherwise continue with step 5.
- The remaining auxiliary nodes are substituted by bends in the edges.
TreeJuggler in Action
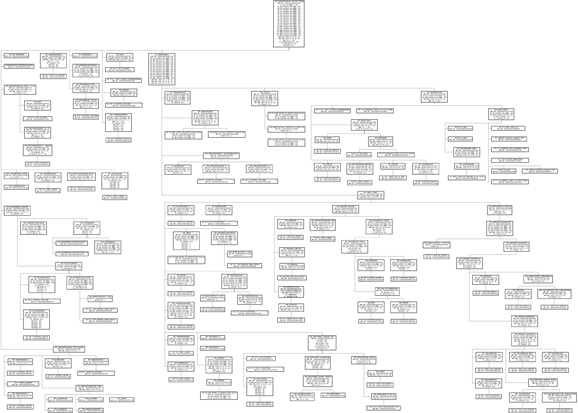
Figure 8 shows an automatically generated tip-over layout created using TreeJuggler. It shows the same data as Figure 3, but the area to visualize the information has been reduced by a factor of 4.65.
TreeJuggler is a Gravisto-Plugin and therefore can also be used to create drawings manually. That is what the TreeJuggler-Toolbox is for (see toolbar in Fig. 9). It can be utilized to execute the various algorithms of TreeJuggler manually for the whole tree or certain subtrees.

Fig. 9: TreeJuggler-Toolbox in Gravisto
Additional requirements (e.g. a certain node has to be at the very left of the drawing, has to lay out its child nodes horizontally, etc.) can also be formulated. This is done by using special node attributes.
TreeJuggler has been used for several years by Airbus Space (formerly Astrium GmbH) with great success. There, it is used to draw product breakdown structures in a project called Graphical Tree. The data visualized is extracted from the company’s SAP system as material lists.
 To get started with Gravisto and TreeJuggler, visit Gravisto on Github. Please note that the former homepage of Gravisto is no longer available (see New Home for Gravisto for more information). After checking out the Java source code using the provided gravisto.psf, you will have a launch configuration for 64 and 32 bit available in your Eclipse IDE.
References
-
- EADES, Peter; LIN, Tao; LIN, Xuemin. Two tree drawing conventions. International Journal of Computational Geometry & Applications, 1993, 3. Jg., Nr. 02, S. 133-153.
- Gravisto: Graph Visualization Toolkit (Poster), Graph Drawing Conference, GD 2004. [PDF]


